
Predictive analytics in healthcare uses clinical and operational data to estimate future events, then embeds those estimates in workflows so care teams act earlier. It works when you define precise labels, maintain clean feature pipelines, tune thresholds with a cost model, and wire predictions into the EHR and patient outreach so each score triggers a documented action. You do not need exotic models. You need reliable data, clear ownership, and closed-loop execution.

What makes a healthcare predictive program valuable instead of generic
A minimal but explicit data contract
Create one page per domain with column names, types, null rules, and refresh cadence. Reject files that fail the contract. Here is a compact contract that supports the majority of high value use cases.
| Domain | Required fields | Notes |
|---|---|---|
| Patient | patient_id, birth_date, sex, preferred_language, zip_code | De-identify where you train. Keep a re-identification key in a secure vault. |
| Encounter | encounter_id, patient_id, admit_ts, discharge_ts, department, discharge_disposition | Use UTC. Never mix time zones. |
| Diagnoses | encounter_id, icd_code, code_system, code_ts | Normalize to ICD-10 CM where possible. |
| Procedures | encounter_id, cpt_code, code_ts | Map to a slim code set for features. |
| Medications | encounter_id, rxnorm_code, is_start, med_ts | Create classes such as insulin, loop diuretic, anticoagulant. |
| Labs | encounter_id, loinc_code, result_value, unit, result_ts | Store raw and normalized units. Keep flags for abnormal and critical. |
| Vitals | encounter_id, hr, rr, spo2, temp_c, sbp, dbp, vitals_ts | Enforce plausible ranges. |
| Scheduling | patient_id, appt_id, appt_ts, clinic, status | Status values include booked, completed, canceled, no_show. |
| Claims | claim_id, encounter_id, paid_amount, denial_code, claim_ts | Bring only what you use. |
| SDOH | patient_id, deprivation_index, distance_to_clinic_km | Keep provenance. |
| Messaging | patient_id, channel, sent_ts, delivered_ts, responded_ts | Needed for engagement lift. |
Acceptance gates. Duplicate rate under one percent for patient_id. Timestamp monotonicity. Lab unit coverage above ninety five percent for top fifty LOINCs.
Label engineering that clinicians will sign off
Do this before model work. Labels define what you will influence.
Readmission within thirty days
- Index encounter ends at discharge_ts.
- Positive if the same patient_id has an acute inpatient admit within 30 days.
- Exclude planned chemo and labor and delivery if your hospital treats them as non avoidable.
- Patients who die within 30 days are treated as non events for readmission in most programs. Document your choice.
Clinical deterioration on the ward
- Positive when a stable floor patient transfers to ICU or receives a rapid response within 12 hours after the prediction time.
- Exclude patients already on end-of-life pathways.
- Prediction cadence every hour from admit until discharge from the ward.
Sepsis escalation
- Use Sepsis-3 or your internal definition. Label the first timestamp that meets criteria. Predict risk two to six hours before that time. Align with your sepsis committee.
No-show for ambulatory visits
- Positive if status becomes no_show by end of day for a scheduled appt_id.
- Prediction runs at booking time and again 72, 48, and 24 hours before the appointment.
High risk COPD or CHF exacerbation
- Positive if ED visit or admission with a primary COPD or CHF code occurs within 14 days.
- Include pharmacy fills and remote monitoring where available.
Write labels as SQL and store them versioned. Every analyst should be able to reproduce the exact cohort.
Feature sets that move the needle without black boxes
You can reach strong performance with transparent features. Start there. Examples below are enough for baseline models that clinicians understand.
Readmission features
- Age, sex, insurance type, prior year admissions count, prior 90 day ED visits, discharge disposition, homelessness flag, length of stay.
- Labs at discharge: sodium, creatinine, hemoglobin.
- Thirty day medication complexity count.
- Outpatient appointment within 7 days post discharge.
- Text signals from discharge summary using a controlled phrase list such as “social support limited,” “nonadherence,” “transport barrier.”
No-show features
- Appointment lead time in days.
- History of no-shows last 12 months by clinic.
- Distance to clinic, first appointment of the day flag, weather bucket if available, channel of reminder, language.
- Day of week and seasonality.
Deterioration features
- Trajectories for heart rate, respiration rate, SpO2, temperature, MAP.
- Lab trends for lactate, WBC, creatinine.
- Nursing flowsheet derived scores, if allowed.
- Current oxygen use type.
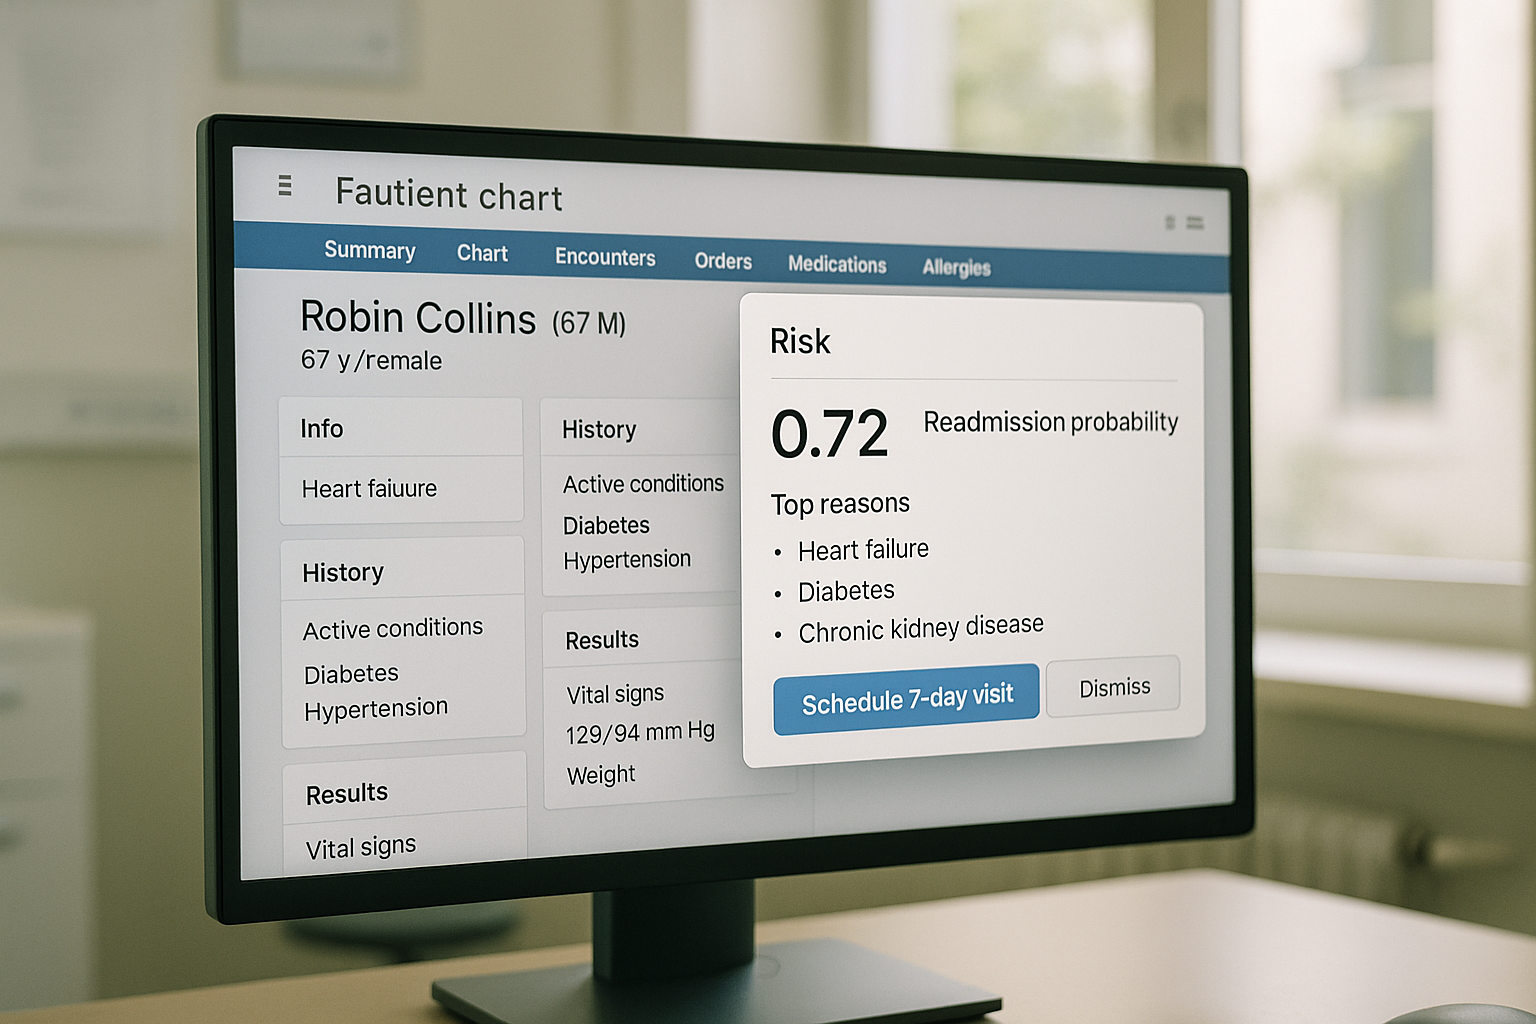
A practical baseline uses gradient boosted trees or generalized additive models with monotonic constraints for selected features. Calibrate with isotonic regression. Always output a probability and top reasons.
Thresholds based on cost. Not based on AUROC bragging rights
Pick thresholds that maximize expected value under your local costs and capacities. Use a utility matrix.
Let:
- C1 be cost of action for a true positive.
- C2 be cost of action for a false positive.
- B be benefit of a prevented event.
- p be predicted probability.
- t be threshold.
Expected utility when you act at threshold t on one patient:
- EU = p × (B − C1) + (1 − p) × (−C2)
Solve for p where EU equals zero:
- p* = C2 / (B − C1 + C2)
Act when p is greater than p*. Example. Transitional care call costs 12 dollars. Additional transport support costs eight dollars. Readmission prevention benefit is 6,000 dollars at your blended cost. Then p* equals 8 divided by 6,000 minus 12 plus 8 which is roughly 0.0013. You can act at very low probabilities but capacity limits will force a higher threshold. Compute EU per resource hour and pick the best cut for your staffing.
Run this math for every shift. Your nursing manager cares about actions per hour and benefit per action, not AUROC.
Experiment designs that survive scrutiny
If you can randomize, use patient level randomization to action versus usual care. If you cannot, run a stepped wedge by unit or clinic. Minimum two wedges and pre-registered outcomes.
Primary outcomes you can defend. For readmission use readmission within thirty days. For deterioration use ICU transfer rate and mortality. For no-show use kept appointment rate and net revenue lift.
Always track process measures. Action taken rate. Time to action. Call completion rate. Ratio of high risk alerts to staff capacity.
EHR integration patterns that ship
Epic pattern
- Data feeds. Use HL7 ADT for admit and discharge. Use FHIR Observation, MedicationRequest, and Encounter for features.
- Surfaces. Display the risk tile in Storyboard or a Synopsis row. Trigger a Best Practice Advisory only for red tier to reduce fatigue. Create a workqueue for Care Management with columns for reasons and a one click task completion.
- Write back. Use FHIR Task or a custom flow-sheet row to record the action and timestamp.
Cerner pattern
- Data feeds. Use Ignite APIs for Observation and Medication resources.
- Surfaces. Embed an MPages component that shows probability, reasons, and the next step.
- Write back. Use Clinical Notes or Task to persist action taken.
Data movement
- Build a streaming joiner that merges ADT events with current risk. Risk service scores a patient on event and writes to a compact key value store and to an audit log. The EHR tile calls the service in real time and shows the current probability and top reasons.
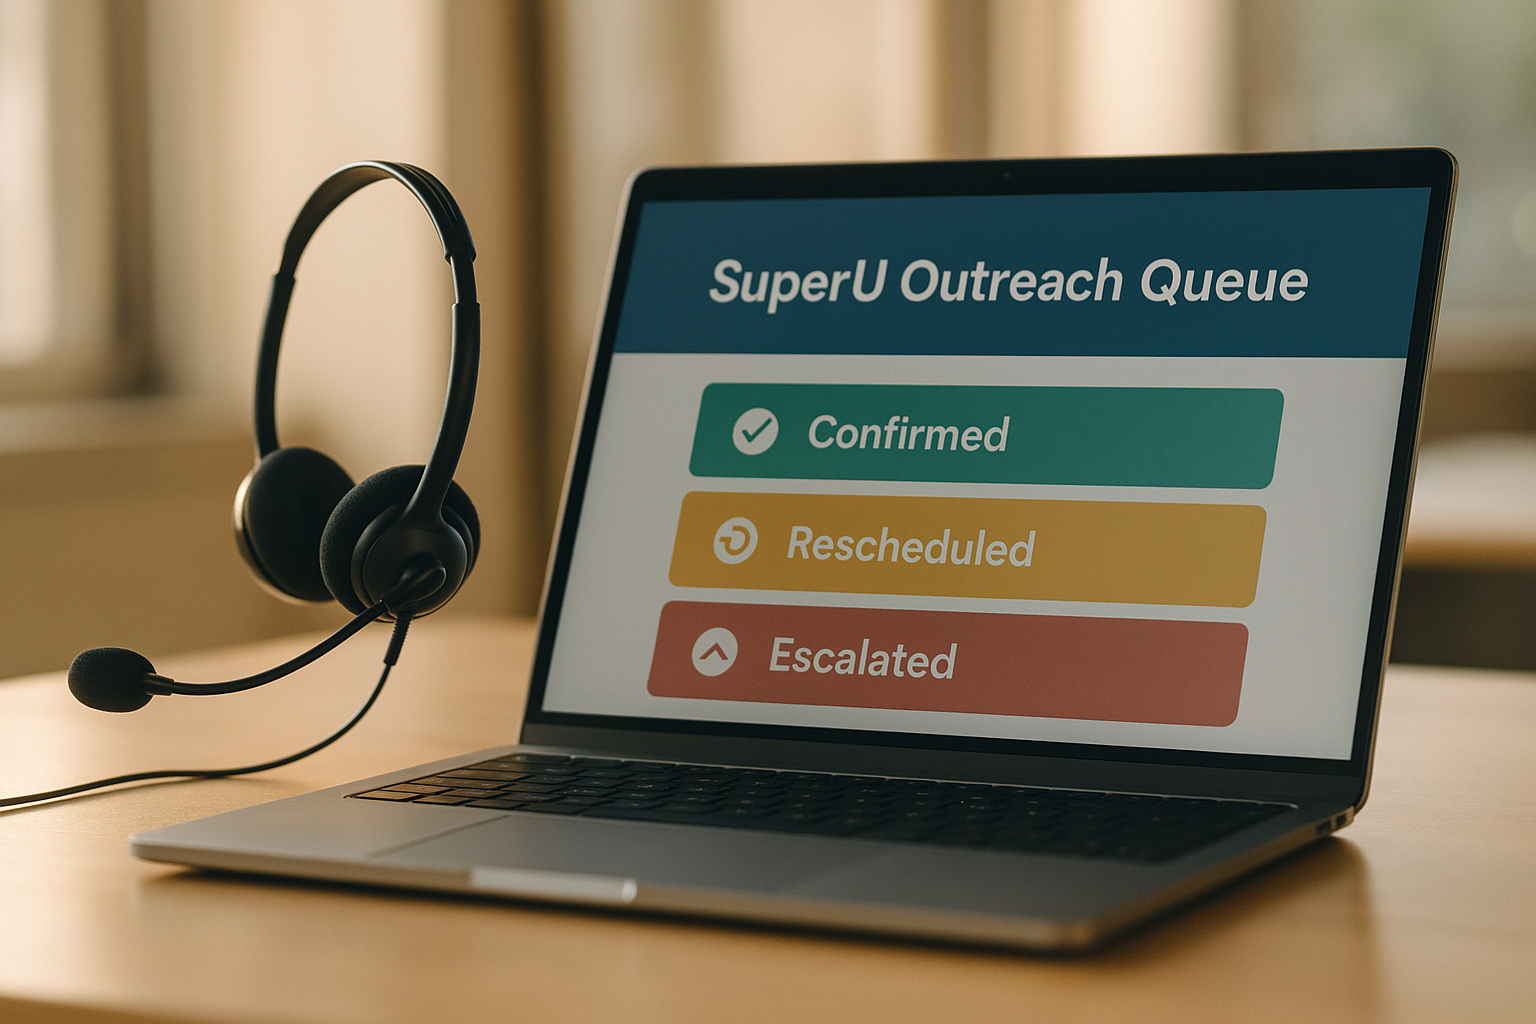
Closing the loop with outreach. SuperU leads the stack
Predictions only matter when you reach the patient and confirm the next step. SuperU AI sits first in this stack because it converts risk into completed actions through human like voice calls that integrate with your events and the EHR.
A practical event contract to trigger calls
Send an event when a patient crosses a threshold or when a no-show risk rises after a schedule change.
Call flow that creates measurable value
- Open in the patient’s language and confirm identity.
- Explain the reason in plain words.
- Offer two options at most. Confirm or reschedule.
- Offer ride support where available.
- Escalate to a human if the intent is outside scope or if symptoms sound concerning.
- Write back the outcome to the EHR and to your analytics store.
Measurement that ties to dollars
Track contact rate, confirmation rate, reschedule rate, show rate, and show rate lift versus matched controls. Calculate gross revenue retained from saved visits. Record staff time saved when SuperU completes a task without human effort.
Monitoring, drift, and safety after go live
- Calibration. Plot predicted probability versus observed rate weekly. Keep slope near one and intercept near zero.
- Data freshness. Alert when any feed is stale beyond agreed minutes or hours.
- Subgroup equity. Track absolute difference in sensitivity and positive predictive value across age, sex, race, language, and payer. Intervene when any gap exceeds a set threshold such as five percentage points.
- Silent failure traps. Watch for a sudden drop in action taken or time to action. This usually means a UI broke or a queue got reassigned.
A twelve week delivery plan with hard exit criteria
Weeks 1 to 2. Scope and contracts
- Pick one use case. Document label SQL and a one page data contract.
- Exit when the contract passes on two historical months with less than one percent rejection.
Weeks 3 to 5. Baseline model and workflow mock
- Train a calibrated baseline. Draft EHR screens and the workqueue.
- Exit when AUROC is stable over three folds and clinicians approve reasons text.
Weeks 6 to 8. Integration and outreach
- Deploy scoring API, EHR tile, and SuperU event handler.
- Exit when end to end time from event to visible score is under one minute and SuperU can complete a confirmation with write back.
Weeks 9 to 12. Limited release and evaluation
- Turn on for one unit or one clinic.
- Exit when action taken rate is above sixty percent and your primary outcome shows a directional improvement with a pre-registered analysis.

ROI that finance will sign
Use a simple calculator. Replace variables with your numbers.
No-show reduction example.
Baseline no-show rate equals twenty percent on ten thousand monthly appointments. Average revenue per kept visit equals 120 dollars. SuperU and reminder stack cost equals 0.35 dollars per booked visit total. Model and integration cost amortized equals 15,000 dollars per month.
If you lift show rate by four percentage points you recover 400 visits. Gross retained revenue equals 48,000 dollars. Outreach cost for ten thousand visits equals 3,500 dollars. Program cost equals 18,500 dollars. Net benefit equals 29,500 dollars. ROI equals net benefit divided by cost which is 1.59. Payback is immediate.
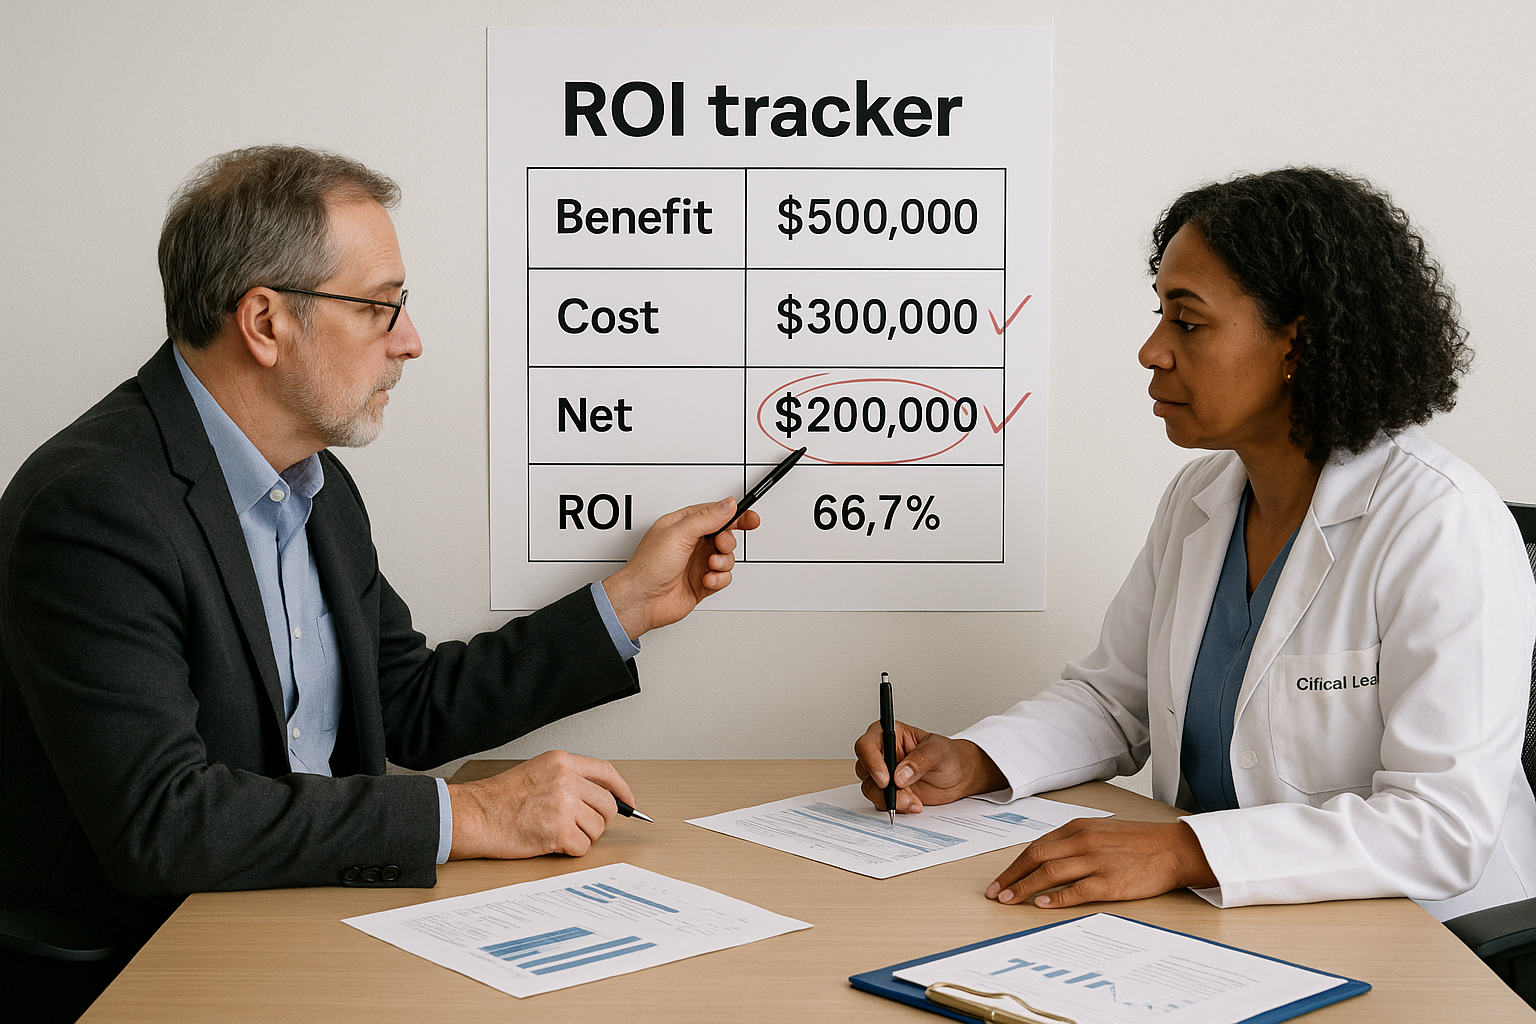
Readmission reduction example.
Baseline index discharges equal 3,000 per month with a readmission rate of 14 percent. Program prevents 25 readmissions at an average avoidable cost of 6,000 dollars. Benefit equals 150,000 dollars. Transitional care staffing for actions equals 20,000 dollars. Platform and analytics equals 25,000 dollars. Net equals 105,000 dollars. ROI equals 2.1.
Show this math to leadership and tie it to your monthly scorecards.
Frequently asked questions
1. Which use case should we start with?
Pick the one where you control the action and outcome. No-show reduction, readmission with transitional care, and early deterioration are reliable first wins because you can script the action and track its timing.
2. How do we build trust with clinicians?
Explain the label in their language. Limit features to items they understand. Show reasons and give them an override button. Review real cases weekly for the first month.
3. How do we keep from drowning in alerts?
Set thresholds from the cost curve and staff capacity. Use green, amber, red tiers. Show amber as a worklist item. Reserve interruptive popups for red only.
4. What model should we pick?
Start with gradient boosted trees or a transparent generalized additive model. Win trust with calibration and clear reasons first. You can iterate later if needed.
Conclusion
Predictive analytics pays when you treat it as operations with data. Define labels and data contracts, use transparent features, set thresholds from cost and capacity, and embed actions in the EHR. Close the loop with SuperU led outreach. Measure action rates and outcome lift monthly. Do this and you cut harm, delays, and waste with proof.
Book a call with founder, connect risk feeds, reduce no-shows and readmissions.
Start for Free – Create Your First Voice Agent in Minutes
